PASDOS : Physics-Aware Statistics for Data On Surfaces
Back to Table of Figures.
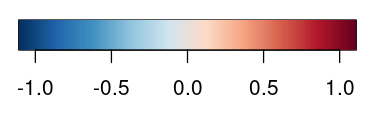
Fig. 4.3: Spatio-temporal evolution of the covariance between a reference point (in blue) and the rest of the points in the domain, for the spatio-temporal model simulated in Fig 4.2. The color (red to blue) represent the value of the covariance.